The Filters Tree#
PyVista does away with the VTK visualization pipeline which allows linking of multiple objects so that they can be changed simultaneously. (ParaView users will be familiar with this system from the “Pipeline Browser”.) As explained here, it’s straightforward to mimic the pipeline in PyVista on a case-by-case basis. However, we lose the tree-like logical structure allowing multiple visualization elements to change automatically with their parent mesh. For example, we might want to plot the director field as glyphs on a plane, but also color that plane by the twist of the director; then we’d hope for both the glyphs and the plane coloring to update when we move the plane.
In open-ViewMin, we extend PyVista, mimicking to some extent Paraview’s Pipeline Browser, by forming a tree of parent-child relationships between FilterFormula objects that each create a mesh anew whenever their parent FilterFormula’s mesh is updated.
We have not actually changed anything about the PyVista filter functions themselves. Instead, we maintain a dictionary, FilterTreePlot.filter_formulas, which for each mesh knows the FilterFormula object that created it.
Schematically, whenever parent_mesh is updated, we call parent_mesh.filter_that_creates_child(..., name=child_name), which replaces the former child object with a new one created based on the updated parent.
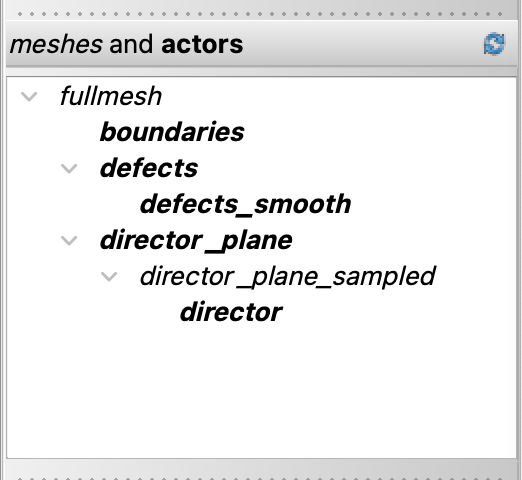
These updates cascade recursively down the Filters Tree until we have updated all relevant meshes and their associated actors (the objects we render).
To accomplish this, we create the child mesh or actor slightly differently than we would in PyVista. As an example, suppose we have a 20x20x20 grid with some vector field dataset defined on it:
import open_viewmin as ovm
import numpy as np

my_plot = ovm.FilterTreePlotQt(dims=(20, 20, 20))
my_plot["fullmesh"]["some_vectors"] = np.random.random((20 * 20 * 20, 3))
and we want to visualize an orange slice normal to z, along with green arrows on this slice oriented according to the vector field.
The PyVista way to do this is:
mesh = my_plot["fullmesh"].mesh

# create the slice
my_slice = mesh.slice(normal=(0,0,1))

# show the slice
my_plot.add_mesh(my_slice, name="my slice", color="orange")

# create the glyphs
my_glyphs = my_slice.glyph(orient="some_vectors")

# show the glyphs
my_plot.add_mesh(my_glyphs, name="my glyphs", color='green')
In open-ViewMin, we instead do the following:
# create and show the slice
my_plot["my slice"] = my_plot["fullmesh"].add_filter(
    "slice", normal=(0, 0, 1)
)

# style the slice
my_plot["my slice"].set(color="orange")

# create and show the glyphs
my_plot["my glyphs"] = my_plot["my slice"].add_filter(
    "glyph", orient="some_vectors"
)

# style the glyphs
my_plot["my glyphs"].set(color="green")
Now, if we were to update "my slice" to change its normal to the x-direction:
my_plot["my slice"].update(normal=(1, 0, 0))
then "my glyphs" will update automatically to the new location of "my slice".
What happens under the hood here is that when we do (schematically)
my_plot["child_mesh_name"] = my_plot["parent_mesh_name"].add_filter(
 "filter name", filter_kwargs...
)
open-ViewMin translates this into something like
def reusable_filter(parent_mesh):
    pyvista_filter_function = getattr(mesh, "filter name")
    new_mesh = pyvista_filter_function(**filter_kwargs)
    my_plot.add_mesh(new_mesh, name="new_mesh_name")
Then, reusable_filter(parent_mesh) is called, not just upon the creation of child_mesh, but also every time parent_mesh is updated.
Because the mesh created always has name "new_mesh_name", updated meshes will replace the old ones in the plot.
Alternatively to providing a PyVista filter’s name as a string, you can provide any function of one argument that returns a callable (which will be the PyVista filter):
  my_plot["child_mesh_name"] = my_plot["parent_mesh_name".add_filter(
     lambda mesh: mesh.filter_callable, filter_kwargs...
  )